Study population
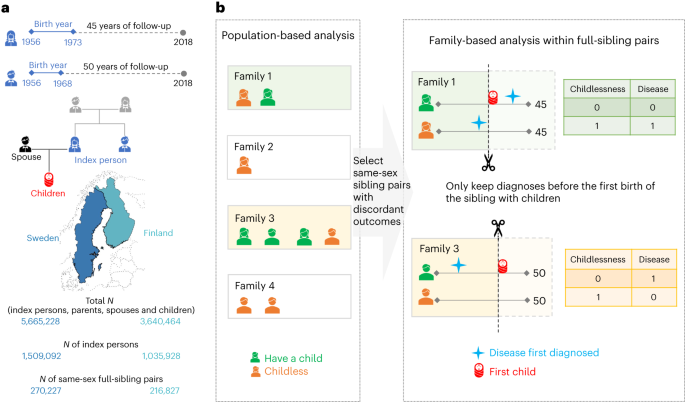
Our study population included 1,425,640 women and 1,119,380 men, who were born after 1956 and alive by age 16, did not emigrate, and largely completed their reproductive period by the end of 2018 (Fig. 1a). Among them, 230,198 women and 279,454 men remained childless. The proportion of childless individuals—those with no live-born children—was higher in men (25.4%) than women (16.6%), higher among Finns (23.3%) than Swedes (18.7%) and slightly higher in the general population than in individuals who had same-sex full siblings (0.9% higher in women and 0.5% higher in men). Among individuals with children, a two-child parity was most prevalent in men (47.1%) and women (48.9%), among both Finns (44.0%) and Swedes (50.8%) (Supplementary Table 2). Both women and men with the lowest educational attainment were more likely to be childless (for example, in Finland, 24.2% were childless in women and 37.4% in men) than the general population (for example, in Finland, 18.8% were childless in women and 27.7% in men) (Supplementary Tables 3 and 4). When looking across generations, the education level of an individual’s parents was correlated with that individual’s childless status (Supplementary Tables 3 and 4). For example, among index persons whose parents had completed the first stage of tertiary education, men were slightly less likely to be childless (for example, in Finland, 25.3%) than the general population (for example, in Finland, 27.7%), while women behaved in the opposite way (for example, in Finland, 21.3%, compared to 18.8% in the general population).

a, The birth cohorts, the follow-up period and the number of Finns and Swedes included in the analyses. A total of three generations of familial relationships were considered: for the index persons, the parental information used to match sibling pairs, the children’s information to define the main outcome of childlessness and the registered spouse’s information to determine the secondary outcome of singlehood. Map adapted with permission from MapChart. b, The statistical approach used in the main analyses, where only families with same-sex siblings discordant for childlessness were included. Within each family, we randomly selected one childless sibling as a case, and, as the control, the sibling with children that was the closest in birth order to the case. Within a sibling pair, disease diagnoses were considered only if they occurred at least one year before the birth of the first child or within the corresponding age at which the sibling was childless, since sibling ages differ.
For the entire study population, we have information from nationwide registers covering 414 disease diagnoses across 16 main categories (Supplementary Fig. 2 and Supplementary Table 5). Disease prevalence across the entire follow-up was highly comparable between Finland and Sweden (Supplementary Fig. 3), and we present meta-analysis results between the two countries. Our main analysis focused on 71,524 full-sister and 77,622 full-brother pairs who were discordant on childlessness (Fig. 1b).
Disease diagnoses associated with childlessness
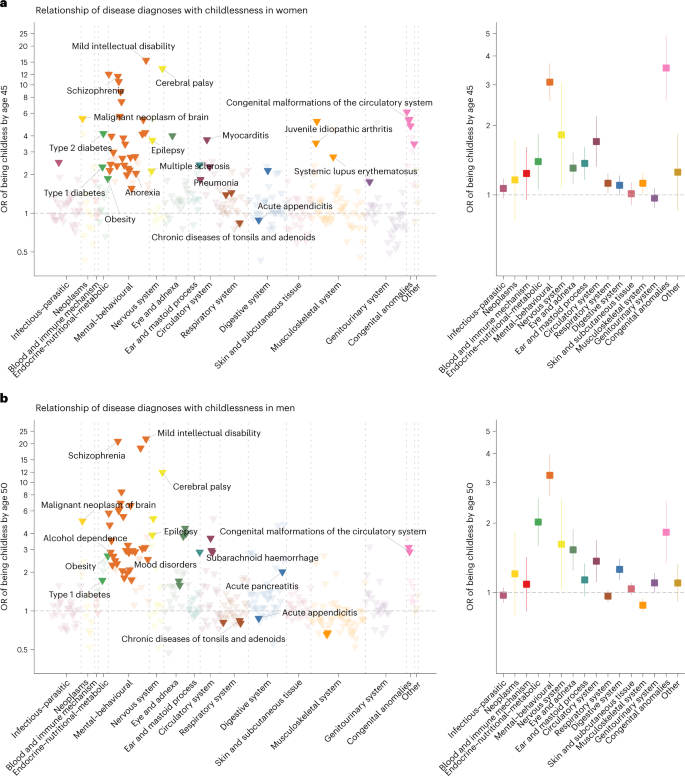
Eleven rare diseases were associated with an almost complete lack of children (for example, severe intellectual disability, childhood leukaemia and muscular dystrophy) (Supplementary Table 6) and were therefore not included in the remaining analyses. Of the remaining 403 diseases (328 in women and 325 in men), 74 were significantly associated with childlessness in at least one sex (P < 1.5 × 10⁻⁴, after multiple-testing correction), including 33 disease diagnoses shared among women and men (Fig. 2). A full list of the results can be found in Supplementary Table 7 or in an interactive dashboard: https://dsgelrs.shinyapps.io/DiseaseSpecificLRS/. More than half of the significant associations were mental–behavioural disorders (26/53 (49%) in women and 30/54 (55.5%) in men), which was, together with congenital anomalies, the disease categories with the strongest associations with childlessness (in women: odds ratio (OR) = 3.1; 95% confidence interval (CI) (2.6–3.7); in men: OR = 3.2; 95% CI (2.6–4.0)), averaging over all mental–behavioural disorders (Fig. 2 and Supplementary Table 8). There was substantial heterogeneity among different mental–behavioural disorders (P < 0.001 in both women and men in a heterogeneity test). For example, mild intellectual disability was the condition with the strongest association with childlessness (for example, in men, OR = 21.7; 95% CI (10.8–43.5)), while smaller effects were observed for mood disorders (for example, in men, OR = 2.1; 95% CI (1.8–2.3)). Severe diseases of the brain such as cerebral palsy (in women: OR = 13.4; 95% CI (7.9–22.7); in men: OR = 12.0; 95% CI (6.5–22.2)) and malignant neoplasm of the brain (in women: OR = 5.5; 95% CI (2.8–10.8); in men: OR = 5.0; 95% CI (2.8–8.9)), which impair health and functioning in several ways but can also result in behavioural and personality disorders38,39, were also strongly associated with childlessness. For individuals with severe mental disorders or physical disabilities (for example, intellectual disability), especially among women, involuntary sterilization was historically carried out in Finland (from 1935 to 1970) and Sweden (1934 to 1976)40.

a,b, Odds ratios (ORs) are computed for each disease diagnosis (left) and averaged over disease categories (right). The error bars indicate 95% CIs. Only disease diagnoses that are significantly associated with childlessness after multiple-testing correction (P < 1.5 × 10⁻⁴) are coloured. Labels are assigned only for certain disease diagnoses that are described in the text.
Another disease category strongly associated with childlessness, in both sexes, encompassed the endocrine–nutritional–metabolic disorders (in women: OR = 1.4; 95% CI (1.1–1.8); in men: OR = 2.0; 95% CI (1.6–2.6); averaging over all endocrine–nutritional–metabolic disorders). For example, obesity (in women: OR = 1.8; 95% CI (1.5–2.4); in men: OR = 2.7; 95% CI (2.0–3.6)), which is normally recorded in the secondary health-care registers only in severe cases, and type 1 and type 2 diabetes (for example, in women, OR = 2.3; 95% CI (2.0–2.6) for type 1 diabetes and OR = 4.2; 95% CI (2.2–8.1) for type 2 diabetes) were among the diseases with the strongest associations with childlessness.
We found several inflammatory diseases to be significantly associated with childlessness across multiple organ systems including the respiratory, circulatory, genitourinary, digestive, nervous and musculoskeletal systems. For example, a diagnosis of pneumonia (OR = 1.4; 95% CI (1.3–1.6)), myocarditis (OR = 3.7; 95% CI (2.3–6.1)), chronic tubulo-interstitial nephritis (OR = 1.8; 95% CI (1.3–2.3)), multiple sclerosis (OR = 2.1; 95% CI (1.5–3.1)), systemic lupus erythematosus (OR = 2.7; 95% CI (1.6–4.6)) or juvenile idiopathic arthritis (OR = 3.5; 95% CI (2.6–4.9)) significantly increased subsequent childlessness in women. Puzzlingly, but consistent with previous findings41, we observed that chronic diseases of the tonsils and adenoids and acute appendicitis were associated with reduced rather than increased odds of childlessness for women and men (for example, for chronic diseases of the tonsils and adenoids, in women: OR = 0.84; 95% CI (0.80–0.88); in men: OR = 0.84; 95% CI (0.80–0.89)), with similar effect sizes in Finns and Swedes (P for heterogeneity, 0.60 between the two countries in both sexes).
Sex-specific effects
The disease category encompassing congenital anomalies showed markedly different effects between sexes (in women: OR = 3.5; 95% CI (2.6–4.9); in men: OR = 1.8; 95% CI (1.3–2.5); P for sex difference, 3.7 × 10⁻³). Overall, malformations of the digestive system (in women: OR = 4.8; 95% CI (2.2–10.3); in men: OR = 1.7; 95% CI (1.0–3.0); P = 0.03) and the musculoskeletal system (in women: OR = 3.5; 95% CI (2.0–6.1); in men: OR = 1.2; 95% CI (0.7–1.9); P = 3.7 × 10⁻³) were more strongly associated with childlessness in women than in men.
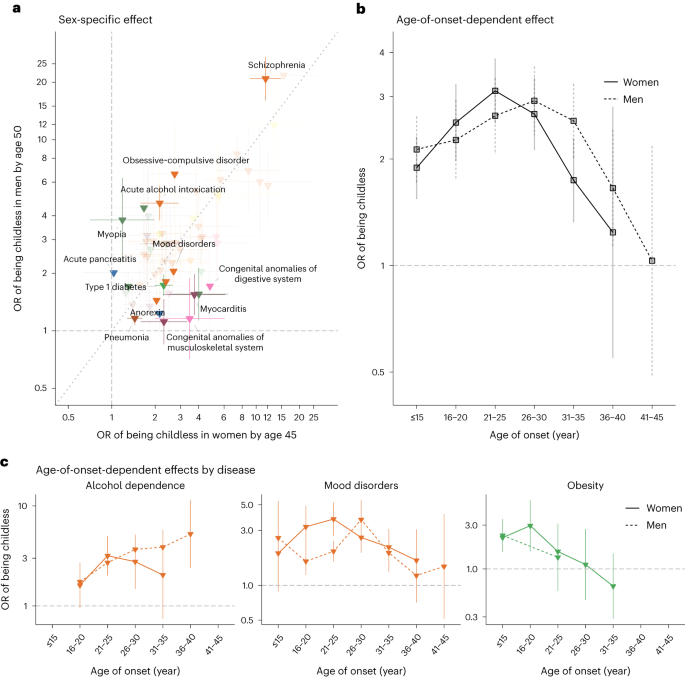
Significant sex-dependent effects were also observed for several mental–behavioural and endocrine–nutritional–metabolic disorders (Fig. 3a). For example, diagnoses of schizophrenia (in women: OR = 11.6; 95% CI (9.1–14.9); in men: OR = 20.8; 95% CI (16.1–27.0); P for sex difference, 1.5 × 10⁻³) and acute alcohol intoxication (in women: OR = 2.2; 95% CI (1.6–2.9); in men: OR = 4.7; 95% CI (3.8–5.7); P < 0.001) had stronger associations with childlessness in men than in women. Diagnosis of type 1 diabetes showed a stronger association in women than in men (in women: OR = 2.3; 95% CI (2.0–2.6); in men: OR = 1.7; 95% CI (1.5–2.0); P = 3.9 × 10⁻³). The stronger association in women might be due to the fact that, in the observational period, women with type 1 diabetes were recommended not to get pregnant if under poor glycaemic control42.

a, Odds ratios for 60 disease diagnoses that significantly increased the odds of childlessness in either men or women. The error bars indicate 95% CIs. Only disease diagnoses that are significantly different between sexes at a nominal P value are coloured. b, The average effect associated with childlessness across 30 disease diagnoses in women and 31 in men, for each age category, as obtained from an age-of-onset-stratified analysis. c, Age-of-onset-stratified odds ratios associated with childlessness for three major diseases/disorders for which we observe a significant trend. The estimate for each age category is computed only if the number of individuals with this disease within the age group is more than five.
Age-of-onset of disease effects
We hypothesized that the age when the disease was first diagnosed, a proxy for the age of onset, would influence the chances of being childless by either capturing disease severity or directly impacting factors underlying individuals’ reproductive trajectory. We first evaluated whether there was a general trend across disease diagnoses (30 in women and 31 in men) that were associated with childlessness and for which we had enough individuals to estimate age-of-onset-stratified effects (Fig. 3b and Supplementary Tables 9 and 10). We observed a nonlinear effect, with the strongest association with childlessness occurring when the disease was first diagnosed between 21 and 25 years old in women (OR = 3.1; 95% CI (2.5–3.8)) and later, between 26 and 30 years old, in men (OR = 3.1; 95% CI (2.4–3.9)). Smaller effects were observed at younger ages (for example, in women, OR = 1.9; 95% CI (1.6–2.3) for onset before 16 years old; P < 0.001) and, especially, older ages of onset (for example, in women, OR = 1.2; 95% CI (0.5–2.8) for onset between 36 and 40 years old; P = 0.04). Despite this broader trend, there was substantial heterogeneity between disease diagnoses (Fig. 3c). For example, among women diagnosed with obesity, the group that received their first diagnoses between 16 and 20 years old had higher levels of childlessness than those diagnosed at later ages (OR = 3.0; 95% CI (1.6–5.6) for those diagnosed between 16 and 20 years old; OR = 1.1; 95% CI (0.5–2.7) between 26 and 30 years old; P for differences, 0.08).
Stratification by parity for individuals with children
In the main analyses, we compared childless individuals to their siblings with children, regardless of parity. We reasoned that childless siblings might be more phenotypically similar to their siblings with fewer children (lower parity) than to siblings who had several children (higher parity). When comparing childless individuals with their siblings with just one child (Supplementary Table 11), 14 disease diagnoses in women and 6 in men had significantly lower odds ratios (Supplementary Fig. 4a,b) than those in the main analysis. For example, in women, the OR of schizophrenia on childlessness dropped from 11.6 (95% CI (9.1–14.9)) to 5.1 (95% CI (3.7–7.0); P < 0.001) when we compared childless individuals with their siblings with just one child. For individuals with higher parities, such as those with exactly two children (Supplementary Fig. 4c,d and Supplementary Table 7) or those with three or more children (Supplementary Fig. 4e,f and Supplementary Table 7), limited differences in ORs were observed compared with the main analyses. Jointly, these results indicate that childless individuals are more similar to their siblings with one child with regard to risk for childlessness-associated early-life diseases than to siblings with higher parities.
Mediation effect by singlehood
Overall, 83.0% of women and 77.0% of men had registered partners before age 45 and 50, respectively. When restricted to childless individuals, the proportion dropped to 36.3% in women and 29.4% in men. We therefore examined to what degree the associations between disease diagnoses and childlessness were mediated by singlehood. First, we estimated the effect of disease diagnoses on the chance of being without a partner by age 45 in women and age 50 in men (Supplementary Figs. 5 and 6). We then compared log-transformed odds ratios on singlehood with those on childlessness and observed a high correlation between these two estimates in both women (R2 = 0.71, P < 0.001) and men (R2 = 0.85, P < 0.001) (Supplementary Fig. 7). A causal mediation analysis performed for each disease also indicated the mediation role of partnership formation, with 29.3% (median) of the disease effects on childlessness in women and 37.9% in men mediated by singlehood (Supplementary Table 12). Different patterns were observed across diseases. For example, singlehood was a significant mediator for women diagnosed with schizophrenia (OR = 2.1; 95% CI (2.0–2.2) for indirect effect; OR = 6.8; 95% CI (5.0–9.2) for direct effect) but not for women with hypertension (OR = 1.2; 95% CI (1.1–1.4) for indirect effect; OR = 2.4; 95% CI (1.6–3.5) for direct effect).
We next investigated whether some of the associations between disease diagnoses and childlessness remained significant among partnered individuals. We considered 133 disease diagnoses in women and 123 in men, which had more than 30 affected individuals with registered partners in the sibling-based analysis. Some diseases that were strongly associated with singlehood (for example, mild intellectual disability) could not be included in the analyses because they were too rare among partnered individuals. Nonetheless, we observed 6 diseases in women and 11 in men that remained associated with childlessness among partnered individuals (Supplementary Fig. 8). Compared with the estimates obtained from both partnered and unpartnered individuals, the effects on childlessness were largely reduced for most disease diagnoses (Supplementary Fig. 9), such as epilepsy (for example, from OR = 3.7; 95% CI (3.2–4.3) for all women to OR = 1.8; 95% CI (1.4–2.4) for partnered women) and acute alcohol intoxication in men (from OR = 4.7; 95% CI (3.8–5.7) for all men to OR = 2.4; 95% CI (1.5–3.8) for partnered men). Several endocrine–nutritional–metabolic diseases retained a strong association with childlessness among partnered individuals, such as obesity in men (all men: OR = 2.7; 95% CI (2.0–3.6); partnered men: OR = 3.3; 95% CI (1.9–5.7)) and type 1 diabetes in women (all women: OR = 2.3; 95% CI (2.0–2.6); partnered women: OR = 2.5; 95% CI (2.0–3.2)).
Population-based and sensitivity analyses
We performed several sensitivity analyses to determine the robustness of our estimation. First, our main results were based on within-sibling analysis, which can account for unmeasured familial factors but also made several assumptions, including siblings being generalizable to the population. We thus also obtained population-based estimates from a matched case–control design controlling for several potential confounders (Supplementary Fig. 10). Overall, the population-based design resulted in larger sample sizes, similar ORs and smaller CIs compared with the sibling-based design (Supplementary Fig. 11). However, stronger associations were observed from the population-based design in men for psychoactive substance abuse (for example, for alcohol dependence, OR = 2.9; 95% CI (2.5–3.2) from the sibling-based design and OR = 3.8; 95% CI (3.5–4.0) from the population-based design; P < 0.001) and mood disorders (OR = 2.1; 95% CI (1.8–2.3) from the sibling-based design and OR = 2.7; 95% CI (2.5–2.9) from the population-based design; P < 0.001).
Second, in the main analysis, we included individuals who died before the end of follow-up (affecting 7.4% of full sisters and 15.0% of full brothers), thus including reproductive-age mortality as one of the possible mechanisms explaining childlessness. To understand the overall effect of reproductive-age mortality, we also conducted an analysis only considering individuals alive by the end of follow-up (Supplementary Fig. 12). Overall, the results were consistent (Supplementary Fig. 13), but we observed two disease diagnoses in men for which the main effects on childlessness were partially explained by reproductive-age mortality: acute alcohol intoxication (all men: OR = 4.7; 95% CI (3.8–5.8); men alive by age 50: OR = 3.9; 95% CI (2.2–3.8); P = 0.006) and subarachnoid haemorrhage (all men: OR = 2.9; 95% CI (1.8–4.5); men alive by age 50: OR = 0.9; 95% CI (0.4–1.8); P = 0.005).
Third, in the main analysis, we opted for conditional logistic regression because the length of follow-up would be identical for the sibling pairs if ignoring reproductive-age mortality (Figs. 1 and 2). When using a Cox proportional hazards model that captured both time-varying effects and death (Supplementary Fig. 14), we observed similar results with reductions in some disease diagnoses (Supplementary Fig. 15).
Fourth, research has found that individuals who remain childless in Finland, particularly men, have lower levels of education43,44, suggesting that it may be important to adjust for educational level. In the sibling-based analysis, we adjusted for differences in individuals’ education levels between siblings but did not find substantial differences in our results compared with the unadjusted main analysis (Supplementary Fig. 16). In the population-based analysis, as expected, significant changes in ORs were observed for many diseases, in both women and men, when we adjusted for individuals’ highest education level (Supplementary Fig. 17). For example, in men, after adjusting for the highest education level, many disease diagnoses had significantly reduced ORs (16 of 45 (35.5%) disease diagnoses with reduced odds of childlessness), while obesity (OR increased from 3.2 (95% CI (2.8–3.7)) to 4.4 (95% CI (3.7–5.2)); P differences, 3.5 × 10⁻³) and acute pancreatitis (OR increased from 1.9 (95% CI (1.6–2.3)) to 2.5 (95% CI (2.1–3.0)); P differences, 0.04) were the only disease diagnoses exhibiting stronger associations.