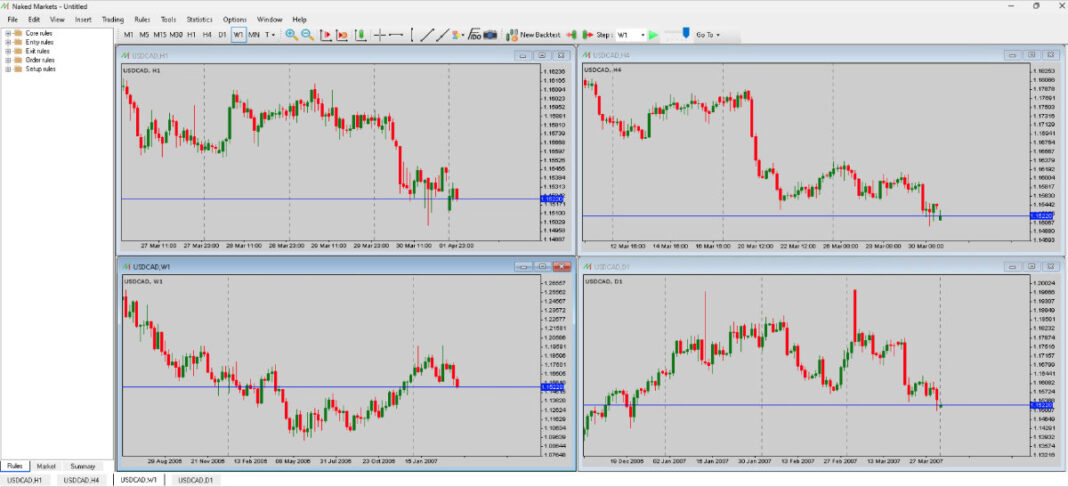
In this tutorial, I’ll show you how I backtest multiple timeframes at the same time.
You’ll learn how to setup multiple charts and have them all run at the same speed while you backtest.
This is easy to do.
There are many software solutions that can do it, but it may not be obvious how to do it, if you don’t know what to look for.
Here’s what it looks like on my laptop.
As you can see, I have the Daily, 4-hour, 1-hour and Weekly charts open.
Having multiple charts running at the same time has many advantages, which you’ll learn about in this tutorial.
If you want to learn more about backtesting in general, be sure to read my backtesting guide on how to backtest in any market.
Alright, let’s get into it…
Why Backtest Multiple Timeframes at the Same Time?
There are many reasons that you may want to have multiple timeframes open at the same time.
I feel that most traders will benefit from watching more than one timeframe when backtesting.
First, when you have multiple charts open at the same time, you don’t have to flip back and forth between the different timeframes to check things like pivot points, trendlines or support/resistance levels on higher timeframes.
This alone can save you a ton of time.
Another reason to use multiple timeframes is that you can take trades on all of those timeframes.
Let’s say that you want to backtest the same trading strategy on the Daily, 4-hour and 1-hour charts.
Having the ability to take trades on all of those charts at once will be much faster compared to testing each timeframe individually.
Now, I’ve personally found this a little hard to do in the past.
But if you have Rules setup on each of your charts, then you can have your backtest pause every time a trading setup condition happens.
Finally, you can not only test multiple timeframes at the same time, but you can also have charts of multiple markets running at the same time.
I’ll get into multiple markets in another tutorial, but for now, let’s take a look at how to setup the charts.
How to Setup a Backtest With Multiple Timeframe Charts
I’ll demonstrate how to do this with NakedMarkets because that’s what I use.
But the process will be similar, regardless of which software you use.
This method also works in Forex Tester and other software.
First, open NakedMarkets and start a new backtest.

Select the settings for your backtest, along with the market you want to test.

Once you’ve finished the setups, you’ll see a blank chart.

Now go to: File > Add new chart > [your current market]
This will add another chart.

If you want to add more timeframes, keep adding charts until you have all of the charts you want.
Then resize each chart so they all fit nicely on your screen.
You can also layer the charts if you want the charts to be bigger.
Now select each chart and change the timeframe to the one you want to display on that chart by clicking on the timeframe selectors in the toolbar.

You can see the timeframe of each chart in the upper left corner of the window.

Once you have setup the timeframes for each chart, select the timeframe that want to advance all of the charts at.
You can do this by selecting the Step timeframe in the toolbar, next to the Play button.

For example, if you select the 5-minute timeframe, all charts will advance in increments of 5 minutes.
Now click the Play button and the charts will move forward in unison, based on the timeframe that’s currently selected in the Step setting.
To take a trade, simply right-click on any chart and enter a trade.

Since all of the charts are moving forward at the same speed, it doesn’t matter which chart you take the trade on.
Your trades will appear on all charts at the same time.
It’s usually best to select a low timeframe in the Step setting because that will show you the greatest level of detail across all the charts.
Doing this will also help you see what candles look like on the the higher timeframe charts, before they close.
Many times, traders don’t wait until a candle closes before taking a trade.
This can lead to impulsive trading.
Watching a candle unfold will help you understand the emotions that you can potentially go through as the candles develop.
Alright one last thing…
You can add Rules to each chart to take trades or simply pause the chart every time your setup happens.
To do this, simply drag the Rule you want to use from the folders on the left, onto the chart you want to use it on.

Conclusion
Now you know how to do a backtest on multiple timeframes at the same time.
Using this method will save you a lot of time and help you find profitable trading strategies faster.
This can be done on many different backtesting platforms, so find out if your software can do it.
If your software can’t do it, then consider using NakedMarkets.
It’s what I use.
All that’s left is to finish your first backtest.
Go for it!

